Valued Stock Report
Application > Warehouse Management > Analysis Tools > Valued Stock Report
Overview
The Valued Stock Report provides a comprehensive view of the inventory held in each warehouse along with its monetary value. It is an essential tool for understanding how much capital is tied up in stock, supporting key business processes such as:
- Financial reporting: Determining the total value of inventory for balance sheets and period-end closing.
- Accounting reconciliation: Comparing stock valuations against general ledger entries to identify discrepancies.
- Cost analysis: Evaluating unit costs across products and warehouses to support purchasing and pricing decisions.
- Multi-warehouse visibility: Reviewing stock values across multiple warehouses, either consolidated at the organization level or broken down by individual warehouse.
The valuation is calculated by summing the cost of every material transaction for each product in the warehouse. Transaction costs are determined by the Costing Server process.
Primary Filters
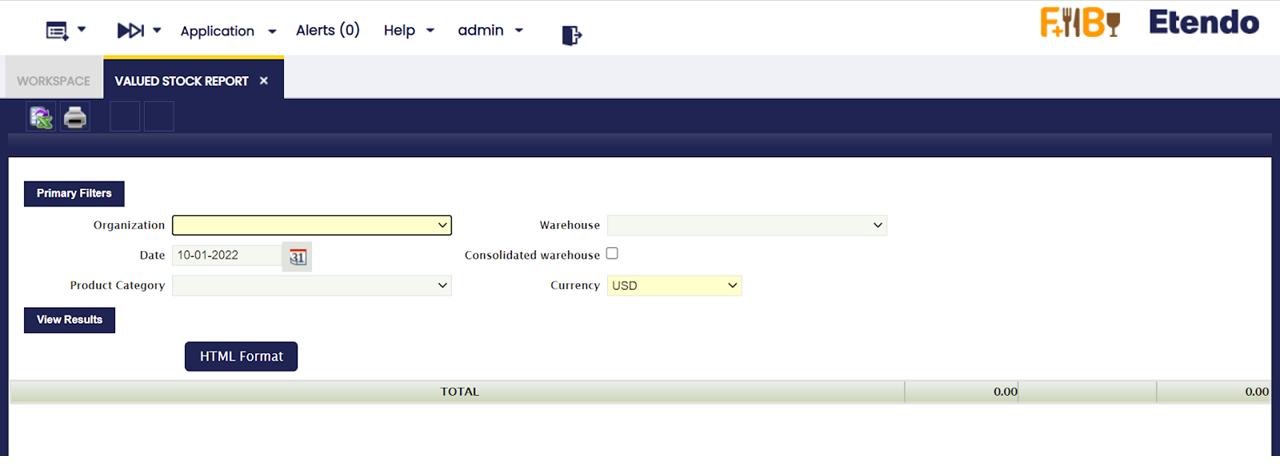
Before generating the report, configure the following parameters:
- Organization: Select the organization to report on. Only organizations set up as Legal with Accounting (an entity that posts its own accounting entries) or Generic (a grouping organization without its own accounting) are available. Ask the system administrator if the organization type is unclear.
- Warehouse: When a Generic organization is selected, all warehouses belonging to that organization are listed. When a Legal with Accounting organization is selected, no specific warehouse selection is available.
- Date: The report displays inventory information up to and including this date.
- Consolidated Warehouse: When checked, stock information is consolidated at the organization level. When unchecked, the report shows a breakdown by individual warehouse.
- Product Category: Optionally filter the report to show only products belonging to a specific category.
- Currency: Sets the currency in which all monetary values (such as cost and valuation) are displayed.
Warning
A conversion rate to the selected report currency must be defined. If this rate is missing, the report may show incorrect or zero values instead of an error message. Verify the conversion rate is set up before trusting the results.
View Results
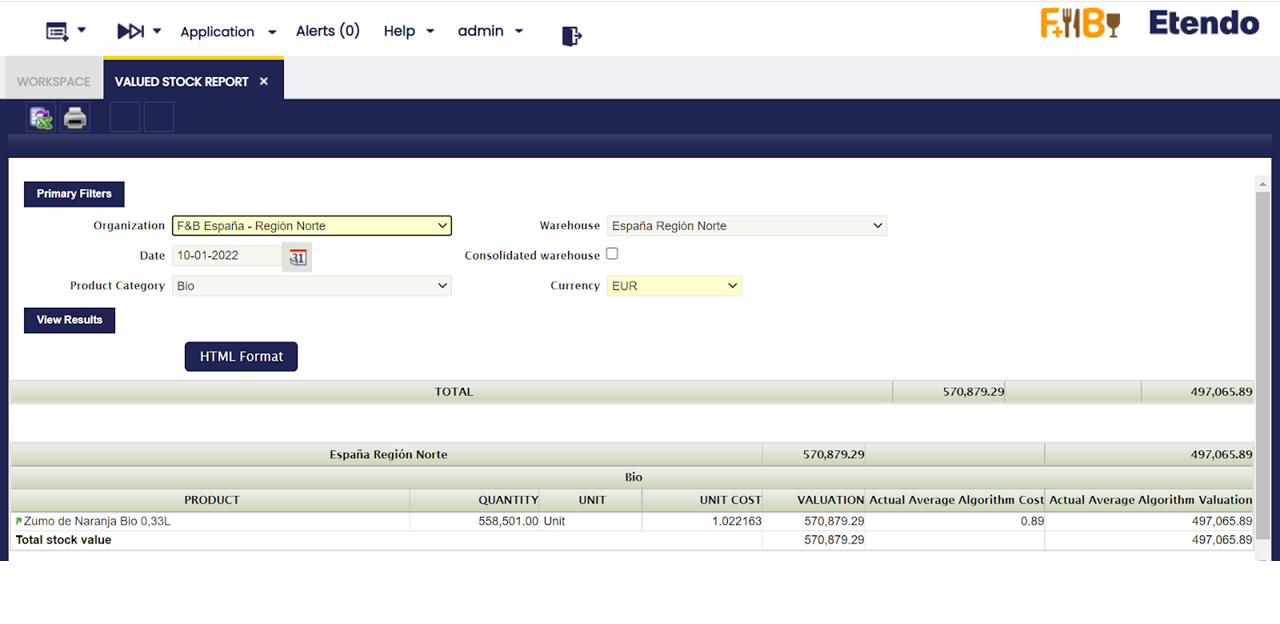
After setting the desired parameters, click View Results to generate the report. Export the report using the HTML Format button.
The report output includes the following columns:
- Product: The name of the product.
- Quantity: The stock quantity of the product as of the selected date.
- Unit: The unit of measure in which the stock quantity is expressed.
- Unit Cost: The cost per individual unit. It is calculated by dividing the total valuation by the stock quantity.
- Valuation: The total monetary value of the stock. It is calculated by adding the valuations of all material transactions that have occurred in the warehouse for that product.
- Actual Average/Standard Algorithm Cost: The most recently calculated Average or Standard cost for the product.
- Actual Average/Standard Algorithm Valuation: The stock valuation based on the current Average or Standard cost. It is calculated by multiplying the stock quantity by the current cost.
Info
Valuation reflects the historical cost of the transactions that built up the current stock. Actual Average/Standard Algorithm Valuation reflects what the stock would be worth today at the product's current costing method. These two figures can differ. Use Valuation to reconcile against posted accounting transactions, and use Actual Average/Standard Algorithm Valuation to see the stock's value at today's cost.
Improving Report Performance (Data Pre-Calculation)
Note
This step is optional. The Valued Stock Report works without it. However, if the report takes a long time to generate because the system has a large volume of transactions, enabling data pre-calculation can significantly reduce waiting times.
The system can summarize (pre-calculate) inventory data for each closed accounting period in advance, so the report does not have to process every individual transaction each time it runs. For this feature to work:
- Accounting periods must be defined in the Fiscal Calendar.
- At least some periods must be in Closed or Permanently Closed status.
Info
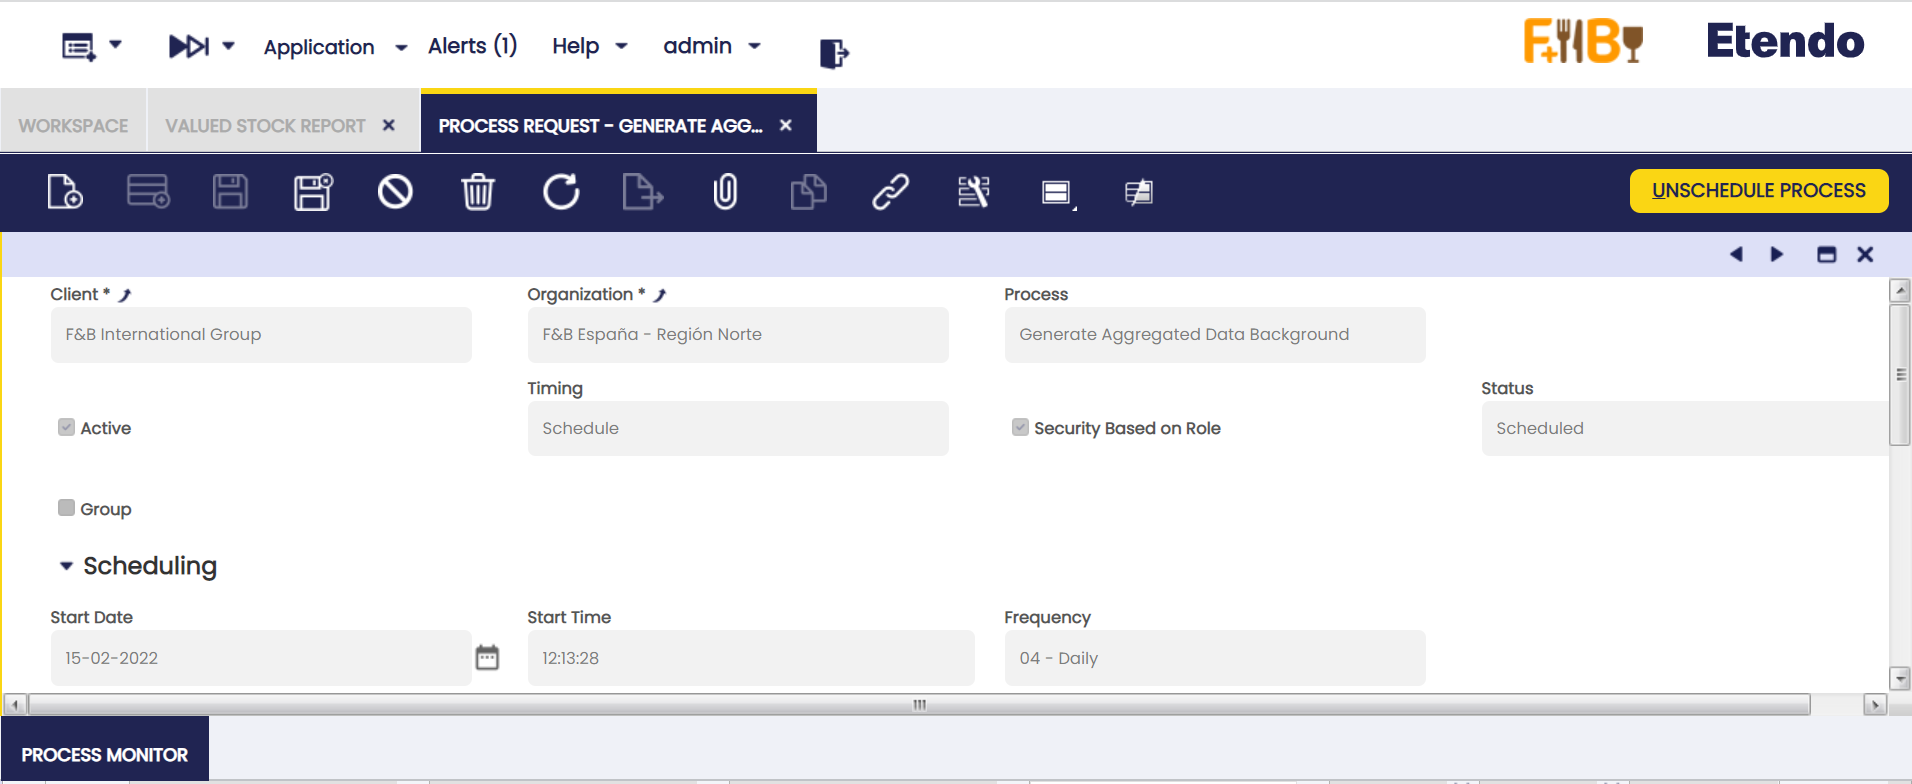
To enable this feature, schedule the background process named Generate Aggregated Data Background through the Process Request window.
The pre-calculation covers all transactions up to the most recent closed period. Transactions occurring after that period are still calculated in real time. If there is a long span of open periods with many transactions, the report may still experience slower performance.
Info
It is recommended to schedule this process to run daily during a period of low system activity. The process only generates new pre-calculated data when an additional period has been closed or permanently closed since the last run.
Limitations
When the system pre-calculates data for a closed period, it combines all transactions in that period into a single summary. The original date of each individual transaction is not kept.
What this means for multi-currency reports: If the report runs in a currency different from the organization's base currency, the system converts the pre-calculated totals using the exchange rate on the period's closing date, not the exchange rate on the date each transaction originally occurred.
As a result, small differences in currency values may appear compared to running the report without pre-calculation enabled, where each transaction would be converted at its own date's exchange rate.
This work is a derivative of Warehouse Management by Openbravo Wiki, used under CC BY-SA 2.5 ES. This work is licensed under CC BY-SA 2.5 by Etendo.