Pareto Product Report
Application > Warehouse Management > Analysis Tools > Pareto Product Report
Overview
The Pareto Product Report classifies products into three categories — A, B and C — based on the proportion of total warehouse value each product represents. This technique is commonly known as ABC analysis, and it helps organizations focus inventory management efforts where they matter most.
For example:
| Category | Share of warehouse value | Typical action |
|---|---|---|
| A | ~80 % | Cycle-count weekly, negotiate supplier terms, keep safety stock tight |
| B | ~15 % | Cycle-count monthly, standard reorder rules |
| C | ~5 % | Cycle-count yearly, consider consolidation or discontinuation |
Prerequisites
The classification is based on the cost of each product. Before running the report, make sure the following are in place:
- A validated Costing Rule for the organization.
- Up-to-date Material Transaction costs (found under
Warehouse Management>Transactions>Material Transaction) — these are the cost entries recorded each time stock moves in or out.
If either is missing, the report may return zero values or incomplete results.
Parameters
Before generating the report, configure the following filters:
| Field | Description |
|---|---|
| Organization | Filters the report by the selected organization. |
| Currency | Defines the currency in which all monetary values (Cost, Value) are displayed. Defaults to the system currency. |
| Warehouse | Restricts the report to a specific warehouse within the selected organization. |
Warning
A Conversion Rate to the selected currency must be defined for the report to work correctly. Verify this under General Setup > Application > Conversion Rates before running the report.
After setting the filters, choose one of the two actions:
- Search — Displays the results in the same window.
- View Results — Opens the report in a separate view, which can be useful for printing or side-by-side comparison.
Report Output
The report lists every product in the selected warehouse, sorted by descending value, and assigns each product its ABC category.
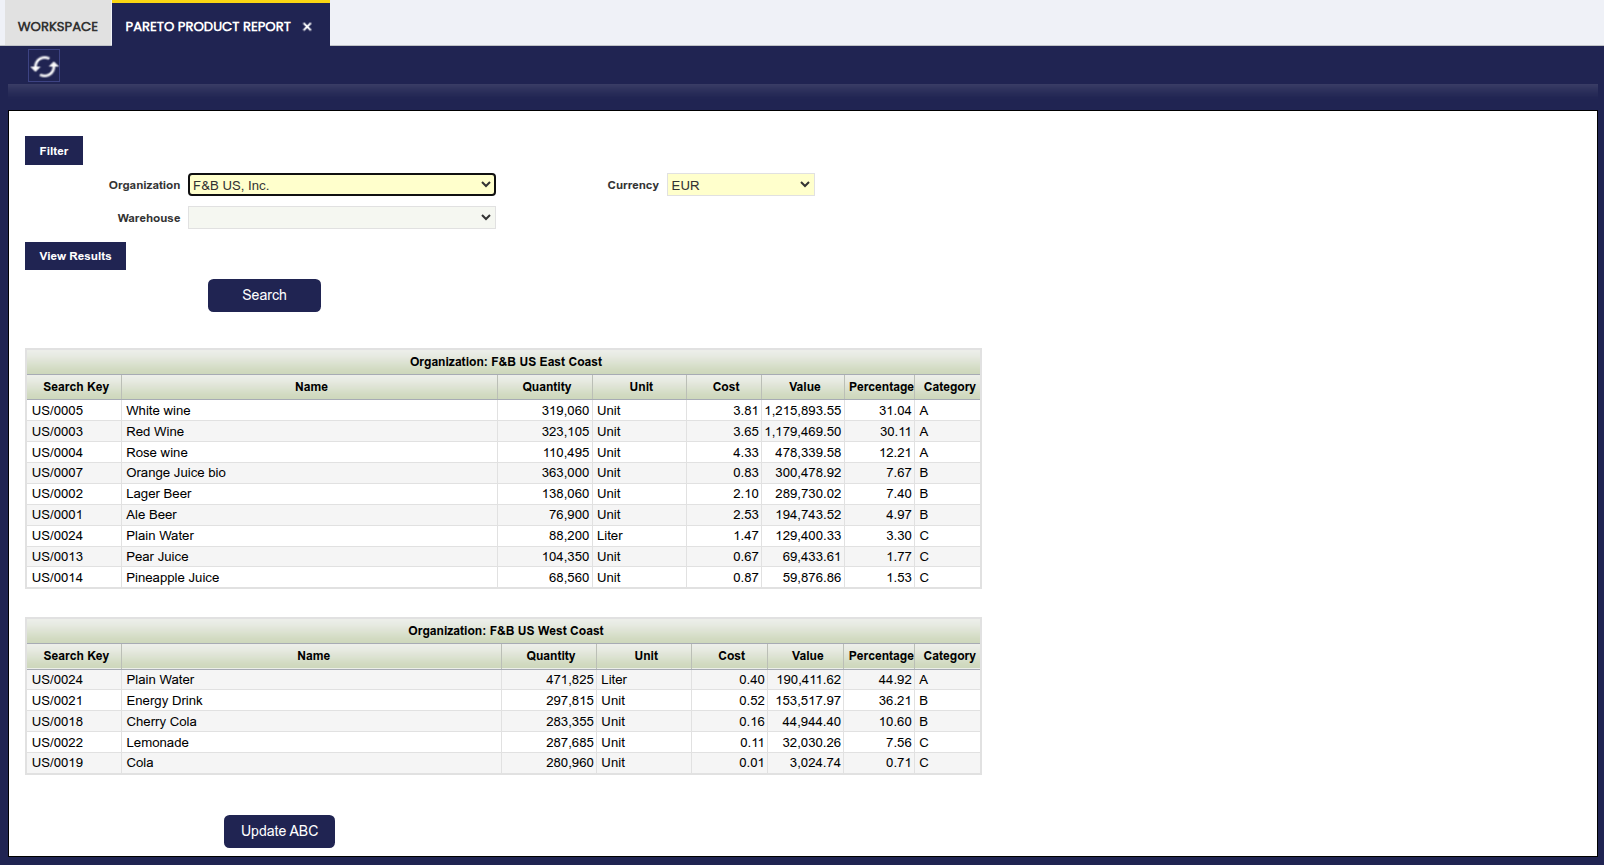
Column Reference
| Column | Description |
|---|---|
| Search Key | The unique identifier code of the product. |
| Name | The descriptive name of the product. |
| Quantity | The current stock (quantity on hand) of the product in the selected warehouse. |
| Unit | The unit of measure for the product. |
| Cost | The unit cost of the product (total Value divided by Quantity). |
| Value | The total inventory value of the product, calculated as the sum of all its material transaction costs. |
| Percentage | The ratio between the product Value and the total value of the warehouse (the sum of all report lines). |
| Category | The ABC classification assigned to the product (A, B or C). Products whose cumulative value reaches up to 80 % of the total are classified as A, those between 80 % and 95 % as B, and the remainder as C. |
Reading the results
Products at the top of the list (Category A) have the highest individual impact on warehouse value. Focus review and control efforts on these items first.
Update ABC
The Update ABC button at the bottom of the window writes each product's classification back to the ABC field in the Org. Specific tab of the Product window.
- If a record already exists for that organization, the value is updated.
- If no record exists, a new record is created.
Once persisted, the ABC category becomes available for filtering and reporting in other areas of the application — for instance, when defining reorder rules or generating purchasing reports.
When to update
Run the report and click Update ABC periodically — for example, after each inventory valuation cycle or whenever significant stock movements have occurred. This keeps the classification aligned with current warehouse conditions.
Using Pre-Aggregated Data
To use pre-aggregated data, run the Valued Stock Report first. Once that report has been generated, the Pareto Product Report will automatically reuse its results, reducing load time. If you skip this step, the report will still run but may be slower in high-volume environments.
Note
The Pareto Product Report can also run without aggregated data. However, using aggregated data is especially useful in high-volume environments where you experience performance issues when launching the report.
This work is a derivative of Warehouse Management by Openbravo Wiki, used under CC BY-SA 2.5 ES. This work is licensed under CC BY-SA 2.5 by Etendo.