How to Use OpenTelemetry (BETA)
IMPORTANT:THIS IS A BETA VERSION
- It is under active development and may contain unstable or incomplete features. Use it at your own risk, especially in production environments.
- It should be used with caution, and you should always validate backups before executing any critical operation.
Overview
OpenTelemetry is an open-source observability framework that defines a set of vendor-neutral APIs, SDKs, and instrumentation libraries for generating, collecting, and exporting telemetry data—namely traces, metrics, and logs. It provides a consistent programming model across applications and services, enabling you to capture detailed runtime behavior without coupling to any specific back end.
OpenTelemetry and Jaeger together form a powerful observability stack for Etendo Rx microservices. By instrumenting your reactive pipelines with OpenTelemetry, you capture detailed spans and traces across asynchronous boundaries. Exporting this telemetry to Jaeger’s collector and UI gives you real-time visibility into request flows, enabling rapid identification of errors, latency hotspots, and service dependencies. As a result, developers can accelerate feature delivery, improve system reliability, and proactively troubleshoot performance issues in complex distributed environments.
Key Concepts
- Span: A single unit of work or operation, such as a database query or an HTTP request.
- Trace: A tree of spans representing an end-to-end request flow through multiple services.
- Context Propagation: The mechanism by which trace context (trace ID, span ID, baggage) is passed along asynchronous or remote calls.
Sending Traces to OpenTelemetry Service
-
Instrument Your Code
- Add the OpenTelemetry Java SDK (or auto-injection agent) to your Rx-based services.
- Create spans around critical operations (e.g., upstream requests, reactive pipelines like
Flux/Mono).
-
Configure an Exporter
- Use the Jaeger exporter provided by OpenTelemetry to batch and send spans over
UDPorHTTP. - Point the exporter at your Jaeger collector’s address and port.
- Use the Jaeger exporter provided by OpenTelemetry to batch and send spans over
-
Propagate Context
- Ensure that each downstream call carries the current trace context so that spans nest correctly.
Jaeger: Distributed Tracing Back End
Jaeger is an open-source distributed tracing system originally developed by Uber. It provides:
- Collector: Receives spans from instrumented applications.
- Storage: Persists trace data (e.g., in Elasticsearch or Cassandra).
- Query Service & UI: Allows developers and operators to search, visualize, and analyze traces in real time.
Prerequisites
- Install Etendo Rx. For this, follow the Etendo Rx installation guide.
- Install the Platform Extensions Bundle.
-
This project depends on the following tools:
- Docker: version
26.0.0or higher. - Docker Compose: version
2.26.0or higher.
Warning
Avoid install Docker via Snap, can be confined by this sandbox and may not have access to host directories such as
/opt/, which can prevent Etendo Docker containers from starting correctly.Recommendation: install Etendo using the latest ISO(which includes Docker) or install Docker following the official installation guide from your distribution.
- Docker: version
Configure Jaeger Service
-
Enable Utils Services: Enable the necessary util service modules.In the
gradle.propertiesfile, add the following variable:Once the Rx utils service is enabled, execute the following command in your terminal:
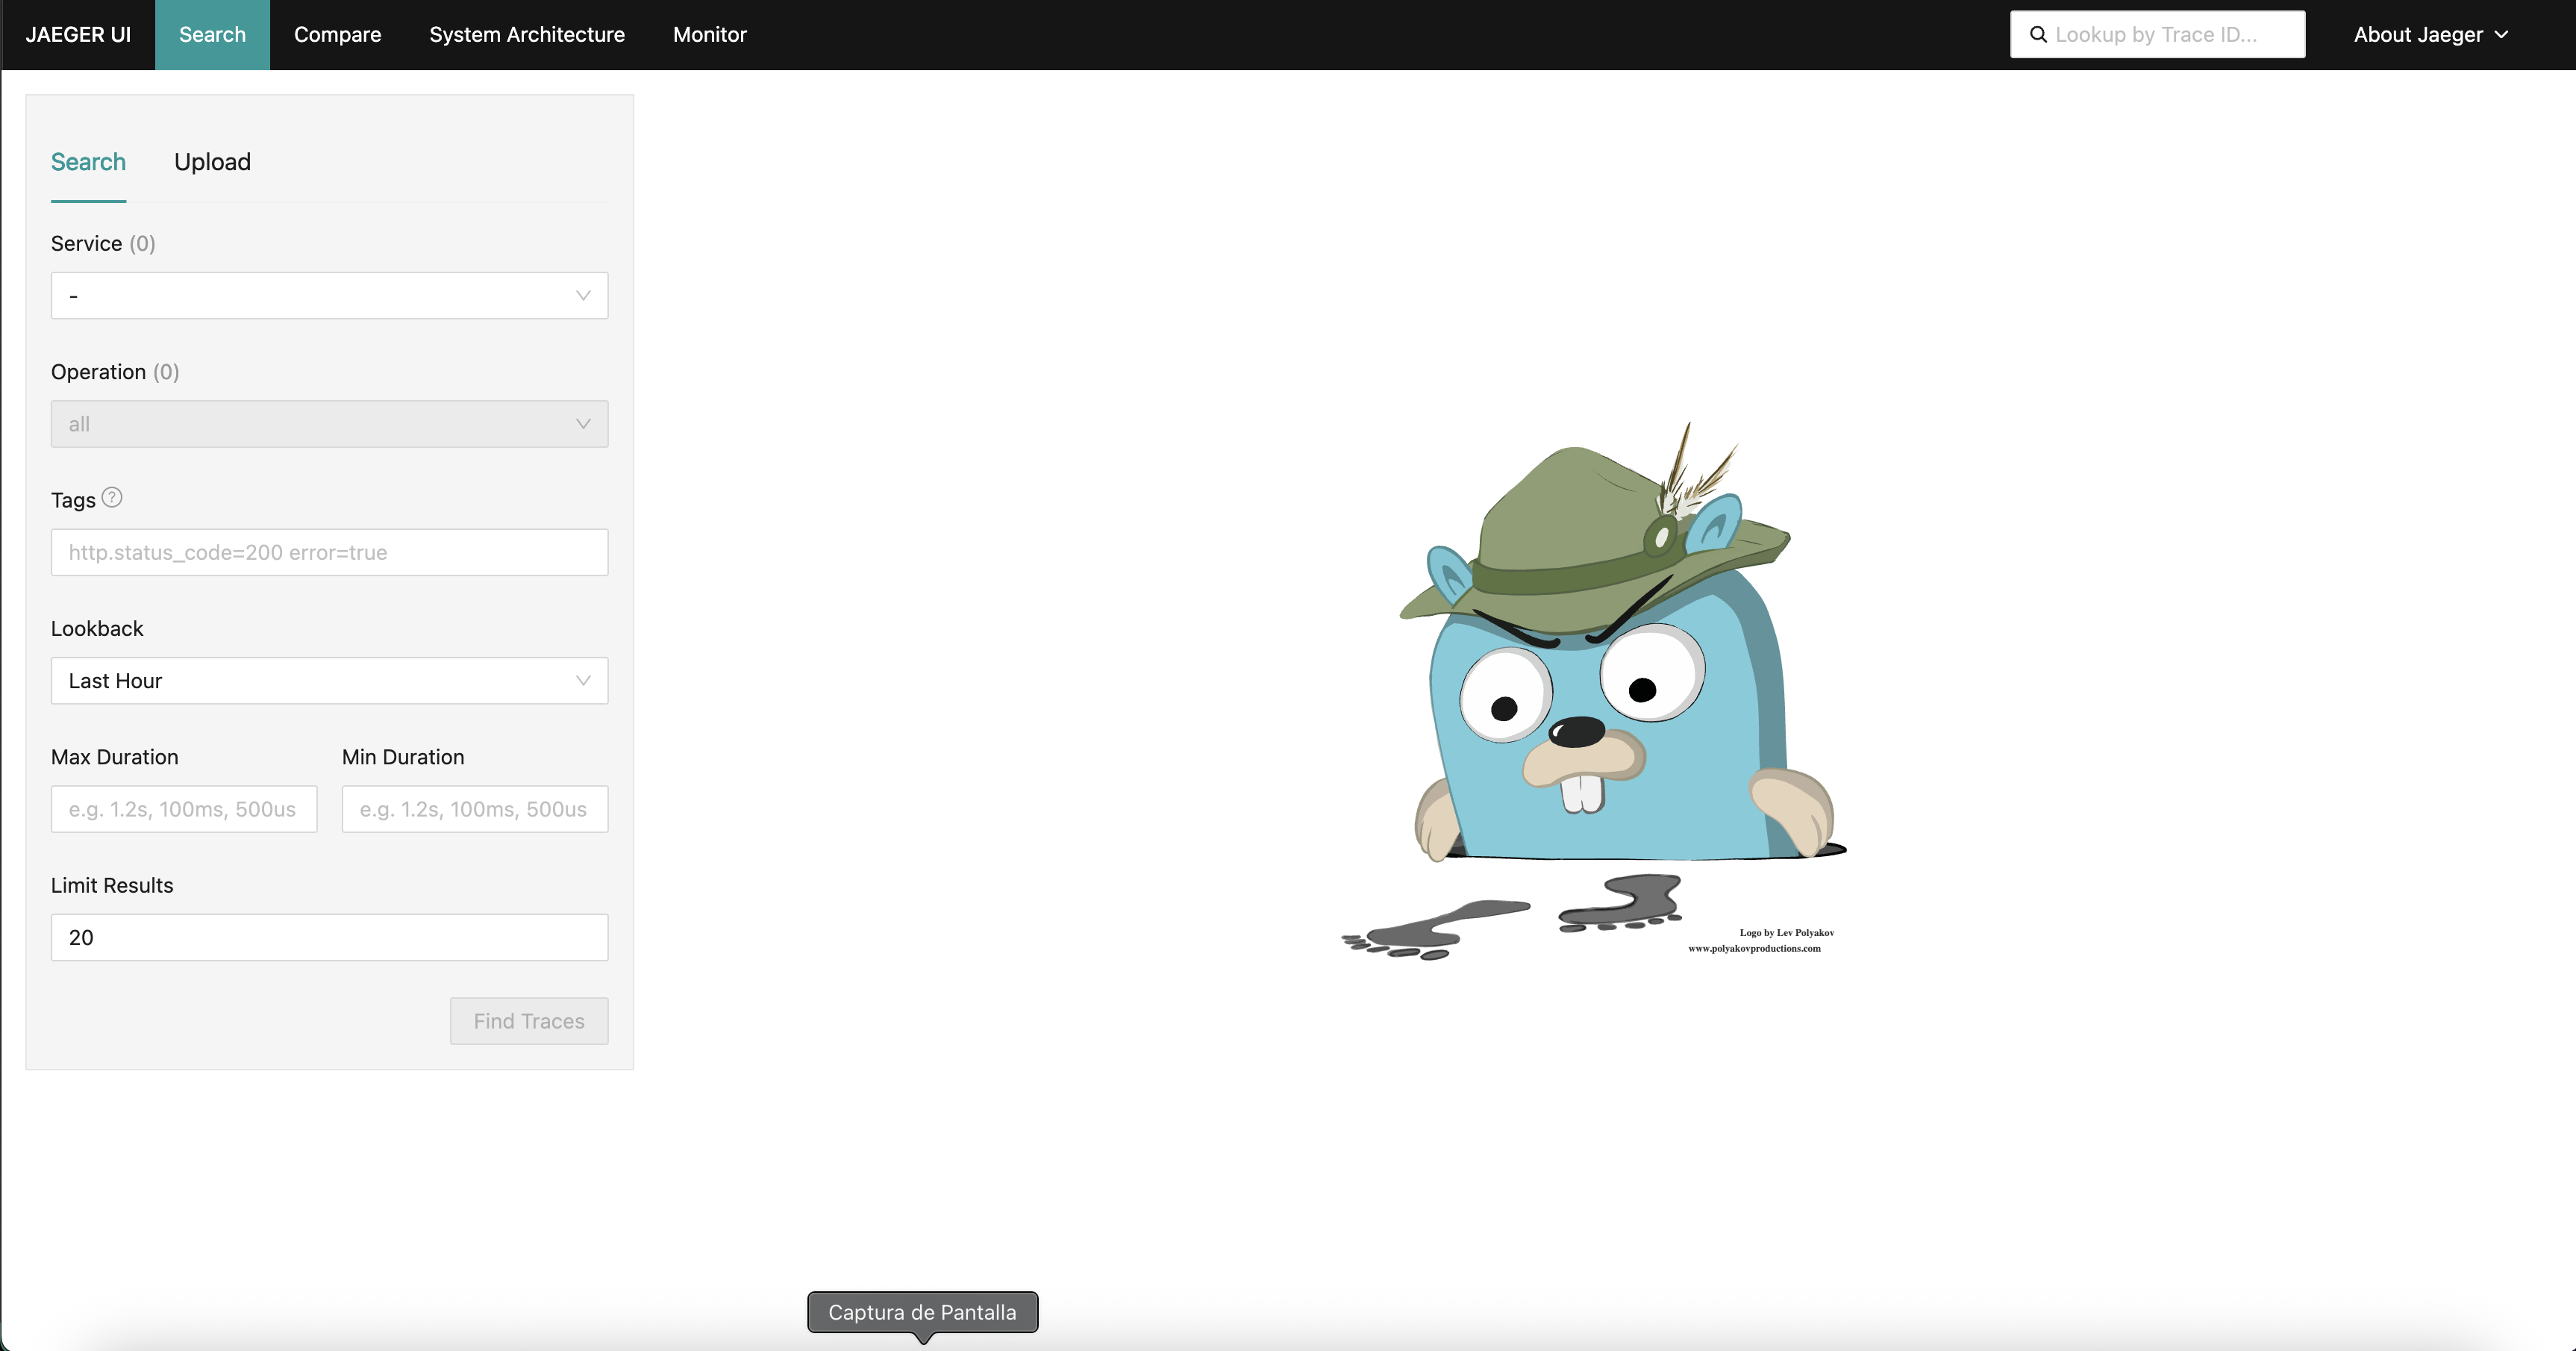
This will launch the Docker container running Jaeger. To access the Jaeger UI, navigate to http://localhost:16686
Initially, there will be no services exporting data to Jaeger. In the next step, we will cover how to enable trace export to Jaeger.
-
Dynamic Das Services: Services based on the Dynamic Das Docker image; currently, the only service using this image is
das. To enable and configure trace export to Jaeger, edit thegradle.propertiesfile adding the following variable:Optionally, you can add additional properties to the
gradle.propertiesfile to further configure the OpenTelemetry agent in the DAS service.Name Description Type Allowed Values Default Notes otel.das.nameDas service name string das otel.das.otlp.endpointstring Any URL http://jaeger:4318Automatically appends /v1/traces\|metrics\|logs}depending on the signal typeotel.das.otlp.protocolTransport protocol for OTLP enum grpc,http/protobuf,http/jsonhttp/protobuf— otel.das.otlp.timeoutTimeout (ms) for OTLP data export (traces, metrics, logs) integer Any positive number 10000— otel.das.metrics.exporterMetrics exporter enum otlp,prometheus,console,logging,nonenone— otel.das.logs.exporterLogs exporter enum otlp,console,logging,nonenone— otel.das.traces.exporterTraces exporter enum otlp,zipkin,console,logging,noneotlp— Once OpenTelemetry is enabled in the Das service, execute the following command in your terminal:
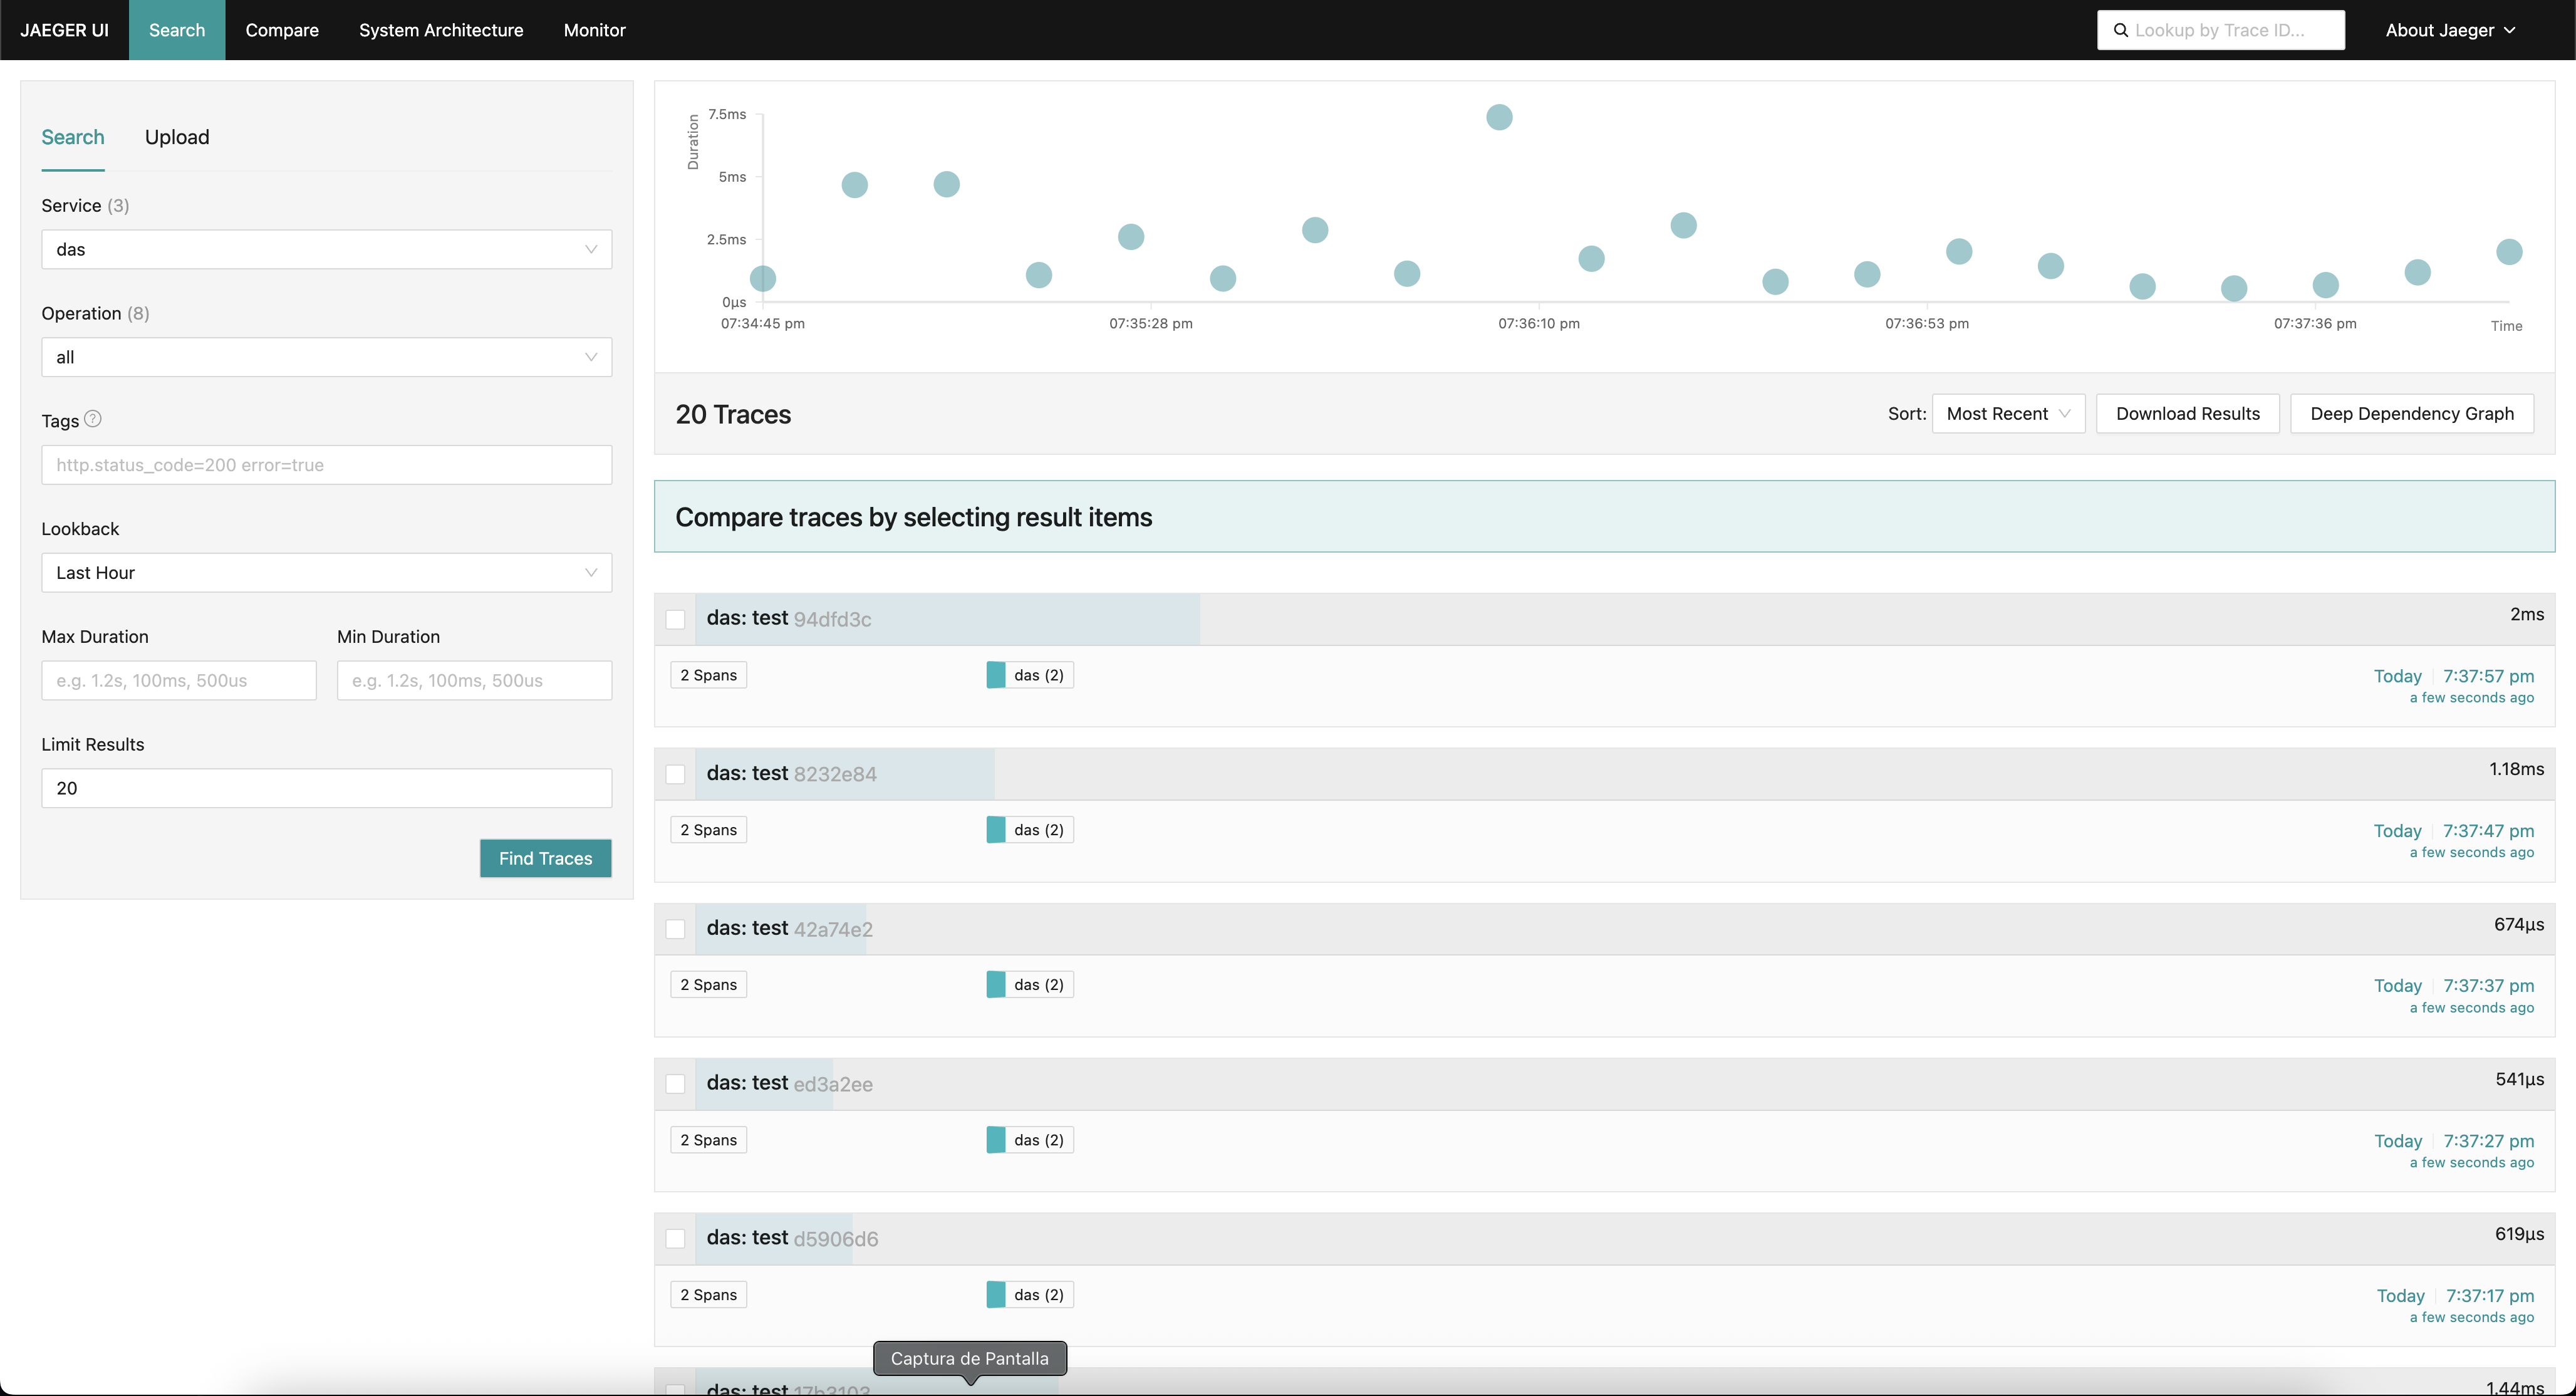
This configuration enables trace export from the Das service to the Jaeger back end. Now, in the Jaeger UI, this service will be selectable.
Warning
This functionality is only available starting from the
etendo/dynamic-das:1.1.0image. For more information, see Dynamic DAS v1.1.0. -
Dynamic Gradle Services: Services based on the Dynamic Gradle Docker image currently are
config,edge,auth,asyncprocess,obconnsrvandworker. To enable and configure trace export to Jaeger, add whichever variables you consider necessary to thegradle.propertiesfile:gradle.propertiesotel.config.enable=true otel.edge.enable=true otel.auth.enable=true otel.asyncprocess.enable=true otel.obconnsrv.enable=true otel.worker.enable=trueOptionally, you can add additional properties to the
gradle.propertiesfile to further configure the OpenTelemetry agent in each service.Name Description Type Allowed Values Default Notes otel.config.nameConfig service name string config otel.config.otlp.endpointstring Any URL http://jaeger:4318Automatically appends /v1/traces\|metrics\|logs}depending on the signal typeotel.config.otlp.protocolTransport protocol for OTLP enum grpc,http/protobuf,http/jsonhttp/protobuf— otel.config.otlp.timeoutTimeout (ms) for OTLP data export (traces, metrics, logs) integer Any positive number 10000— otel.config.metrics.exporterMetrics exporter enum otlp,prometheus,console,logging,nonenone— otel.config.logs.exporterLogs exporter enum otlp,console,logging,nonenone— otel.config.traces.exporterTraces exporter enum otlp,zipkin,console,logging,noneotlp— otel.edge.nameEdge service name string edge otel.edge.otlp.endpointstring Any URL http://jaeger:4318Automatically appends /v1/traces\|metrics\|logs}depending on the signal typeotel.edge.otlp.protocolTransport protocol for OTLP enum grpc,http/protobuf,http/jsonhttp/protobuf— otel.edge.otlp.timeoutTimeout (ms) for OTLP data export (traces, metrics, logs) integer Any positive number 10000— otel.edge.metrics.exporterMetrics exporter enum otlp,prometheus,console,logging,nonenone— otel.edge.logs.exporterLogs exporter enum otlp,console,logging,nonenone— otel.edge.traces.exporterTraces exporter enum otlp,zipkin,console,logging,noneotlp— otel.auth.nameAuth service name string auth otel.auth.otlp.endpointstring Any URL http://jaeger:4318Automatically appends /v1/traces\|metrics\|logs}depending on the signal typeotel.auth.otlp.protocolTransport protocol for OTLP enum grpc,http/protobuf,http/jsonhttp/protobuf— otel.auth.otlp.timeoutTimeout (ms) for OTLP data export (traces, metrics, logs) integer Any positive number 10000— otel.auth.metrics.exporterMetrics exporter enum otlp,prometheus,console,logging,nonenone— otel.auth.logs.exporterLogs exporter enum otlp,console,logging,nonenone— otel.auth.traces.exporterTraces exporter enum otlp,zipkin,console,logging,noneotlp— otel.asyncprocess.nameAsyncprocess service name string asyncprocess otel.asyncprocess.otlp.endpointstring Any URL http://jaeger:4318Automatically appends /v1/traces\|metrics\|logs}depending on the signal typeotel.asyncprocess.otlp.protocolTransport protocol for OTLP enum grpc,http/protobuf,http/jsonhttp/protobuf— otel.asyncprocess.otlp.timeoutTimeout (ms) for OTLP data export (traces, metrics, logs) integer Any positive number 10000— otel.asyncprocess.metrics.exporterMetrics exporter enum otlp,prometheus,console,logging,nonenone— otel.asyncprocess.logs.exporterLogs exporter enum otlp,console,logging,nonenone— otel.asyncprocess.traces.exporterTraces exporter enum otlp,zipkin,console,logging,noneotlp— otel.obconnsrv.nameObconnsrv service name string obconnsrv otel.obconnsrv.otlp.endpointstring Any URL http://jaeger:4318Automatically appends /v1/traces\|metrics\|logs}depending on the signal typeotel.obconnsrv.otlp.protocolTransport protocol for OTLP enum grpc,http/protobuf,http/jsonhttp/protobuf— otel.obconnsrv.otlp.timeoutTimeout (ms) for OTLP data export (traces, metrics, logs) integer Any positive number 10000— otel.obconnsrv.metrics.exporterMetrics exporter enum otlp,prometheus,console,logging,nonenone— otel.obconnsrv.logs.exporterLogs exporter enum otlp,console,logging,nonenone— otel.obconnsrv.traces.exporterTraces exporter enum otlp,zipkin,console,logging,noneotlp— otel.worker.nameWorker service name string worker otel.worker.otlp.endpointstring Any URL http://jaeger:4318Automatically appends /v1/traces\|metrics\|logs}depending on the signal typeotel.worker.otlp.protocolTransport protocol for OTLP enum grpc,http/protobuf,http/jsonhttp/protobuf— otel.worker.otlp.timeoutTimeout (ms) for OTLP data export (traces, metrics, logs) integer Any positive number 10000— otel.worker.metrics.exporterMetrics exporter enum otlp,prometheus,console,logging,nonenone— otel.worker.logs.exporterLogs exporter enum otlp,console,logging,nonenone— otel.worker.traces.exporterTraces exporter enum otlp,zipkin,console,logging,noneotlp— Once OpenTelemetry is enabled on any of these services, execute the following command in your terminal:
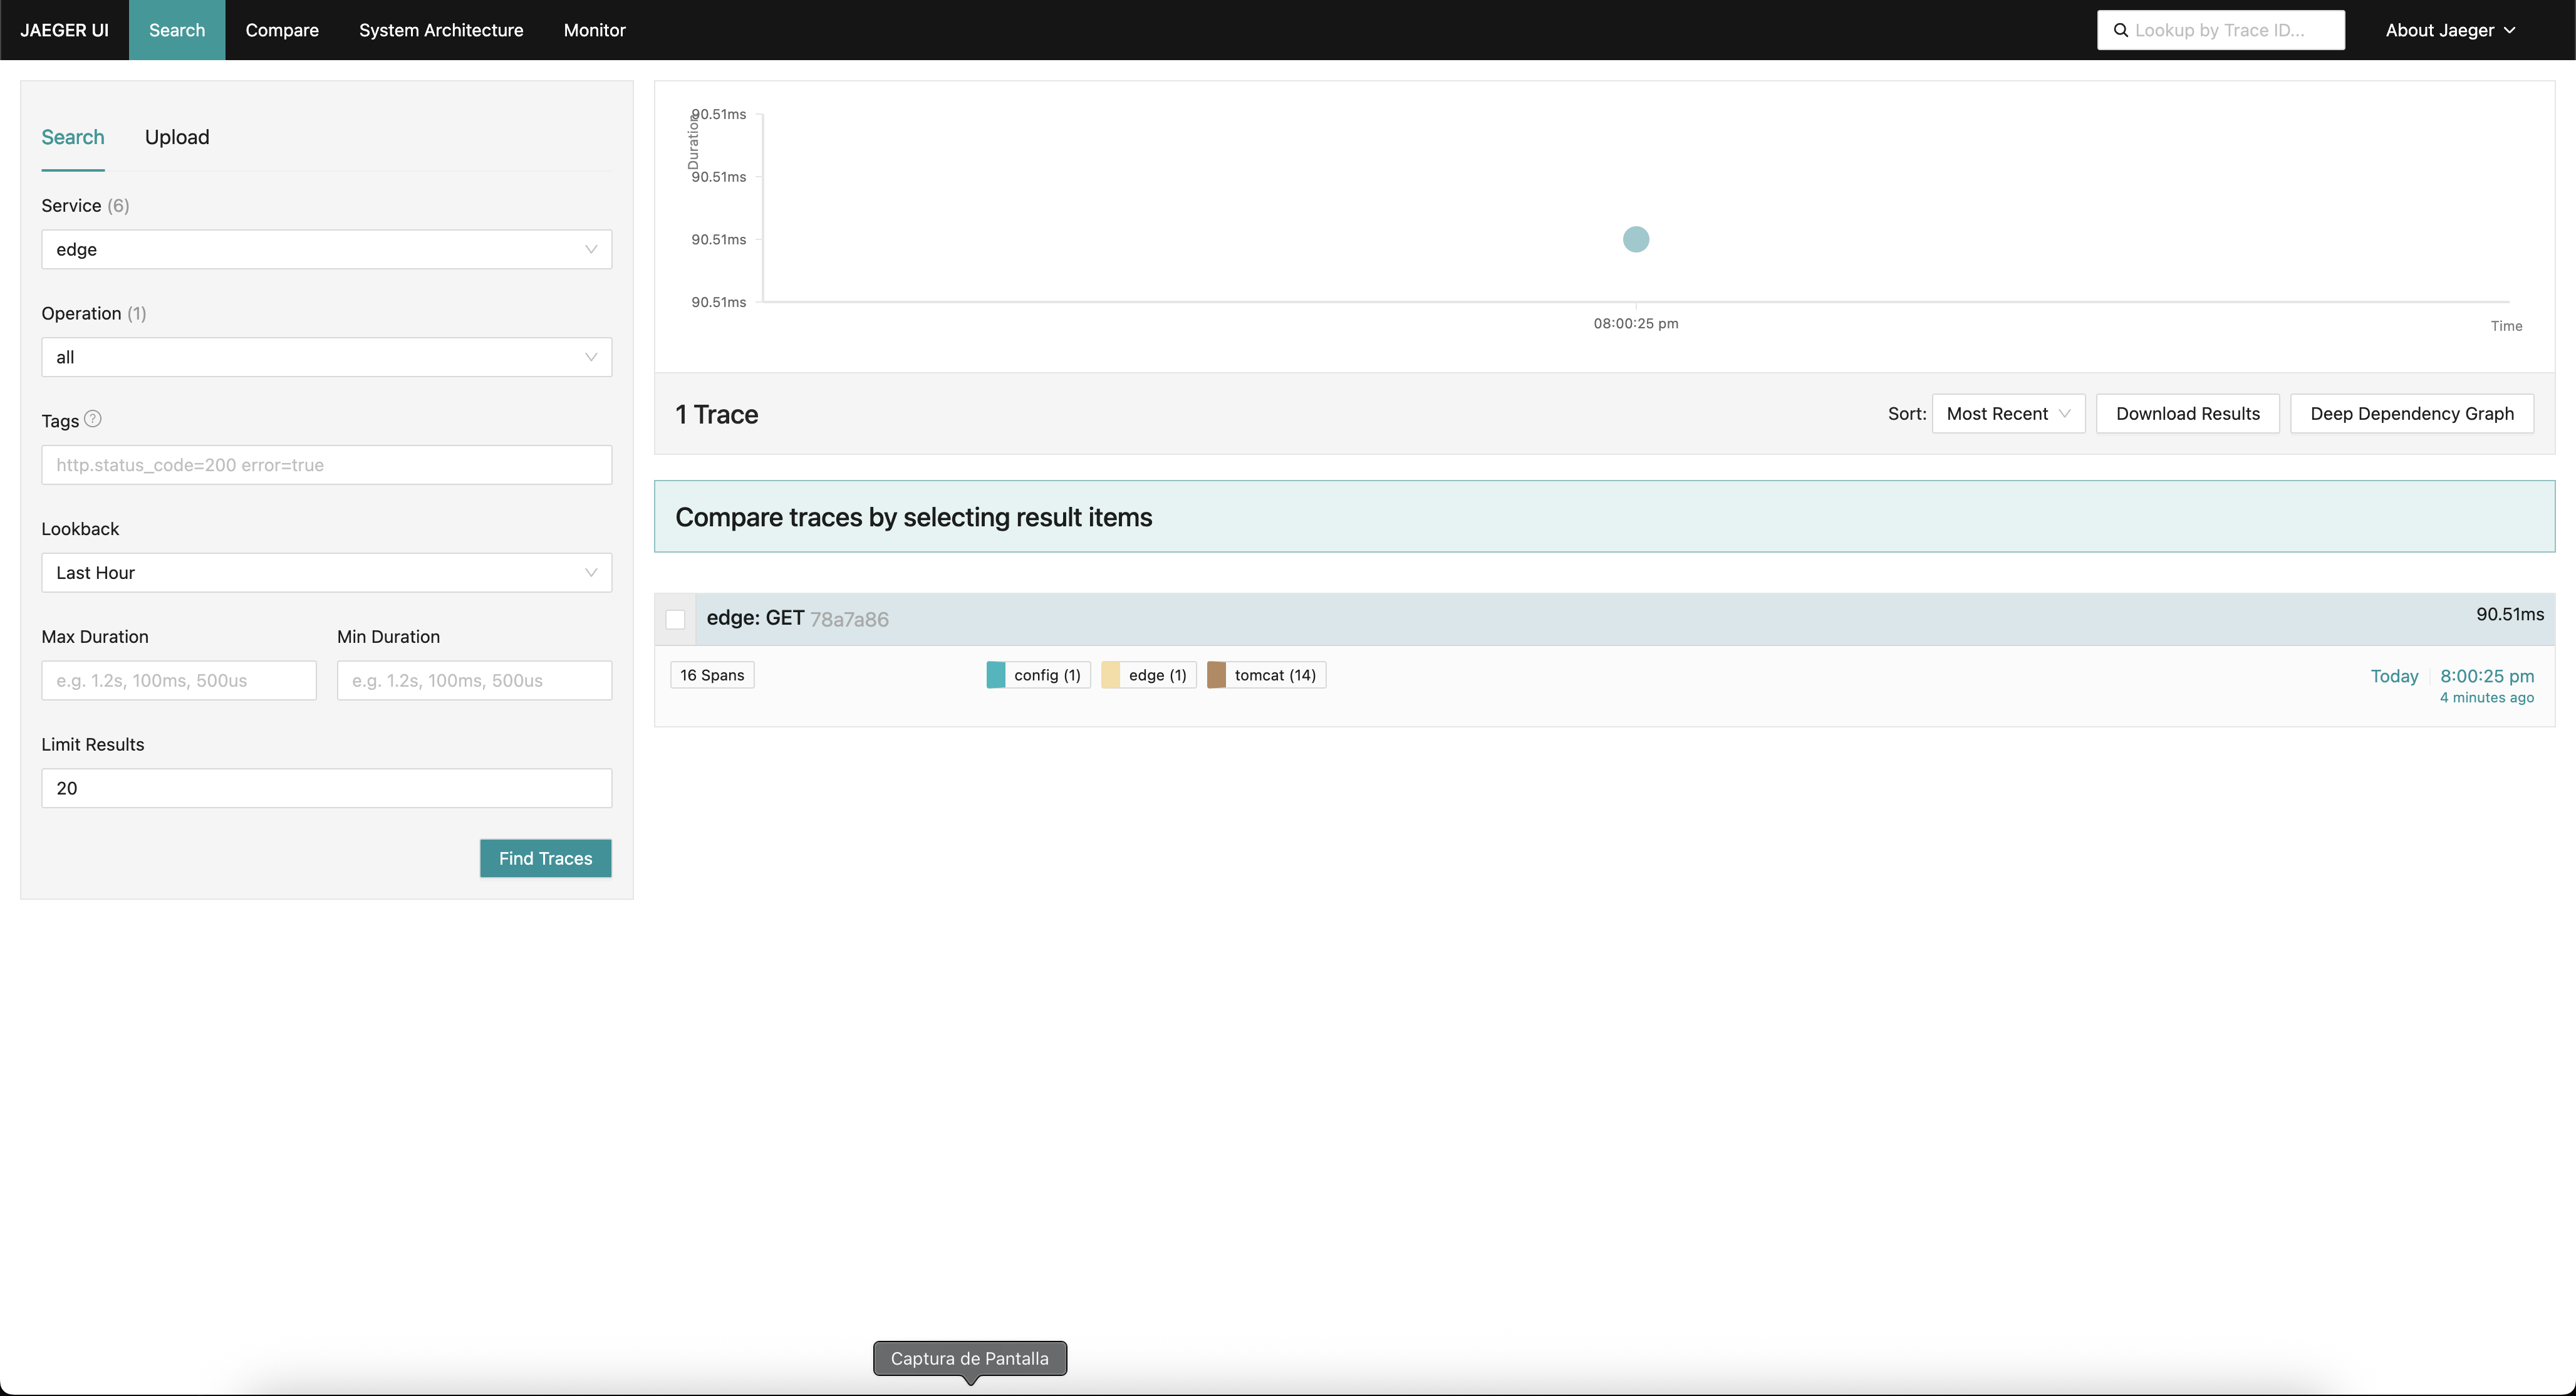
This configuration enables trace export from these services to the Jaeger back end. Now, in the Jaeger UI, these services will be selectable.
Warning
This functionality is only available starting from the
etendo/dynamic-gradle:1.1.0image. For more information, see Dynamic Gradle v1.1.0. -
Tomcat: The Tomcat service can be configured to send traces to Jaeger. In the
gradle.propertiesfile, add the following variable:Optionally, you can add additional properties to the
gradle.propertiesfile to further configure the OpenTelemetry agent in the Tomcat service.Name Description Type Allowed Values Default Notes otel.tomcat.nameTomcat service name string tomcat otel.tomcat.otlp.endpointstring Any URL http://jaeger:4318Automatically appends /v1/traces\|metrics\|logs}depending on the signal typeotel.tomcat.otlp.protocolTransport protocol for OTLP enum grpc,http/protobuf,http/jsonhttp/protobuf— otel.tomcat.otlp.timeoutTimeout (ms) for OTLP data export (traces, metrics, logs) integer Any positive number 10000— otel.tomcat.metrics.exporterMetrics exporter enum otlp,prometheus,console,logging,nonenone— otel.tomcat.logs.exporterLogs exporter enum otlp,console,logging,nonenone— otel.tomcat.traces.exporterTraces exporter enum otlp,zipkin,console,logging,noneotlp— Once OpenTelemetry is enabled in the Tomcat service, execute the following command in your terminal:
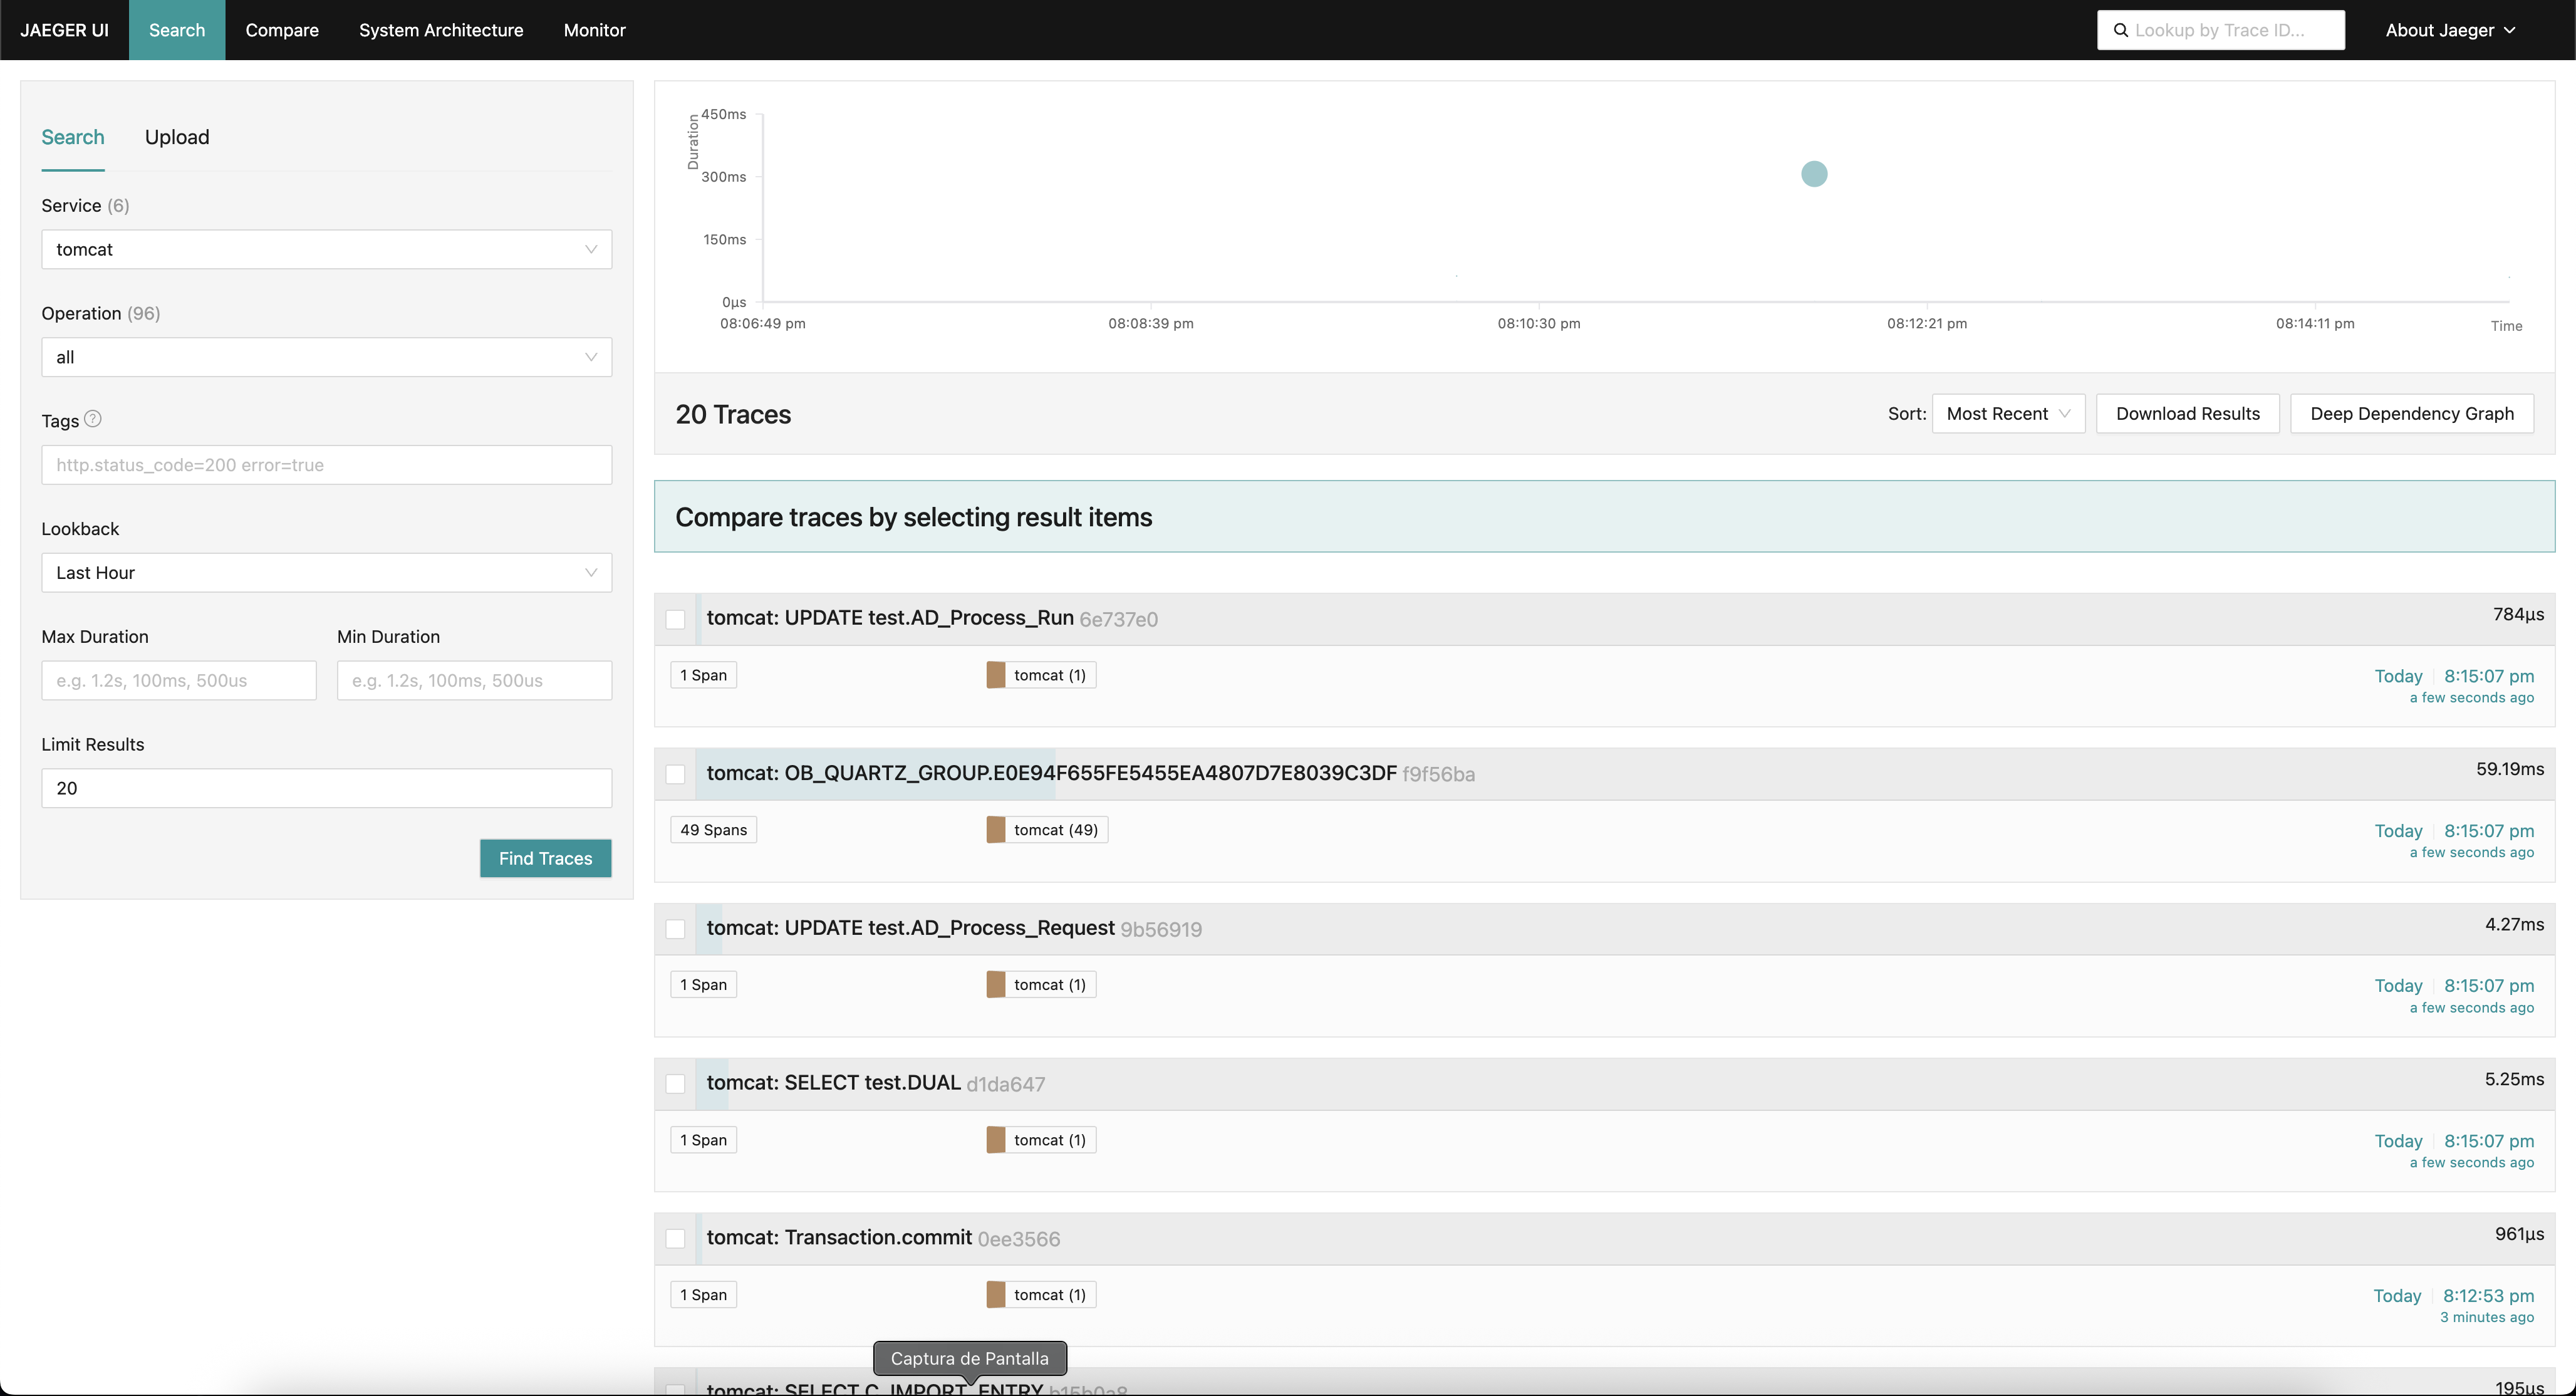
This configuration enables trace export from the Tomcat service to the Jaeger back end. Now, in the Jaeger UI, this service will be selectable.
This work is licensed under CC BY-SA 2.5 ES by Futit Services S.L.